Overflight Traffic Recovery, June–August 2026: The Fleet Returns to Tehran
Overflight traffic is flooding back into contested Middle East airspace. In AeroVigil's own flight-traffic sampling, the Tehran FIR averaged 52.8 aircraft per sampled hour in the week of 10 August 2026 — roughly six times its early-June low of 8.7, and its strongest reading since the June escalation.
On this page · 12
- How far has Tehran overflight traffic recovered?
- Is the recovery Tehran-specific, or regional?
- Does overflight traffic track the conflict signal?
- What does this mean for overflight risk, and the technology to track it?
- Forecast scorecard: grading the July tempo issue
- Forecasts
- Frequently asked questions
- Does returning overflight traffic mean the airspace is safe?
- What does "aircraft per sampled hour" measure?
- Why compare Tehran with Kyiv?
- How does this relate to the conflict-event tempo series?
- Methodology
Overflight traffic is flooding back into contested Middle East airspace. In AeroVigil's own flight-traffic sampling, the Tehran flight information region (FIR) carried a mean of 52.8 aircraft per sampled hour in the week of 10 August 2026. That is roughly six times its early-June low of 8.7, and its strongest weekly reading since the June 2026 escalation drove carriers out. The fleet, in other words, has voted with its flight plans — and it is voting to return.
Data window: weeks of 1 June to 16 August 2026 (Monday-start ISO weeks). Sources are AeroVigil's own pipeline: FIR-level hourly aircraft-count sampling (ADS-B-derived, aggregate counts at FIR-hour granularity) for the traffic series, and GDELT aviation-tagged conflict events for the conflict-tempo series. Every cross-week traffic comparison uses mean aircraft per sampled hour, a coverage-normalized ratio, rather than a raw count. The current status of any specific airspace is volatile and is not frozen in this article; for the live disposition, consult the continuously updated flight-risk feeds.
How far has Tehran overflight traffic recovered?
Tehran FIR traffic has recovered by roughly six-fold from its June trough. In the week of 1 June, the Tehran FIR (OIIX) averaged 8.7 aircraft per sampled hour. That reading climbed week on week — 22.4, then a late-June surge, then a plateau — reaching 52.8 in the week of 10 August. The recovery is not a straight line. Traffic overshot to a peak reading of 65.3 in the week of 29 June, dipped to a local low of 34.5 in the week of 20 July, then re-climbed through early August.
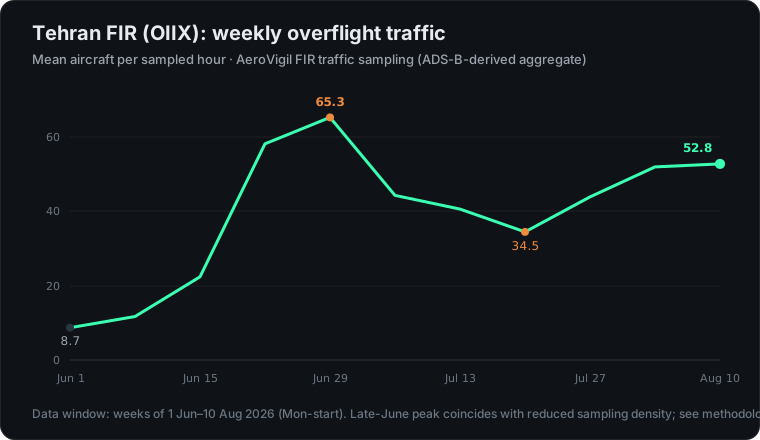
The late-June peak carries a caveat. Sampling density in the Tehran FIR fell in that window — from 163 sampled hours in the week of 1 June to 32 in the week of 29 June — so the 65.3 reading rests on fewer observations and is more exposed to time-of-day mix. The robust claim is the well-sampled comparison: 8.7 in early June against 52.8 in mid-August. Both weeks carry 40 or more sampled hours. The direction and the magnitude of the recovery survive the sampling caveat.
Is the recovery Tehran-specific, or regional?
The recovery is regional, not a single-FIR artifact. Cairo (HECC) rose from 33.9 aircraft per sampled hour in early June to 47.9 in mid-August, a gain of about 41 percent over an already-busy baseline. Damascus (OSTT) roughly doubled, from the 5–7 range in early June to the 13–15 range from July onward. Kyiv (UKBV) — included as a stable-baseline control — held flat near 24 aircraft per sampled hour across the entire window.
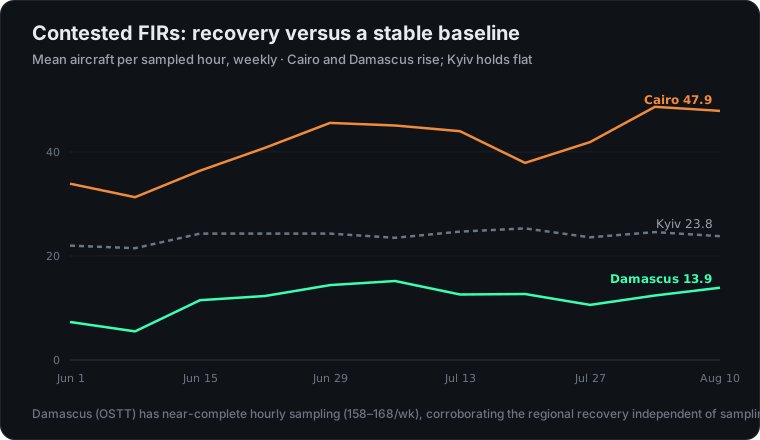
Damascus matters most for confidence in the trend. Its FIR has near-complete hourly sampling — 158 to 168 sampled hours in every full week — so its rise cannot be an artifact of thin or skewed sampling. Damascus climbing while Kyiv stays flat is the cleanest evidence in this dataset that the Middle East recovery is a real change in flying behaviour, not a measurement wobble. Baghdad (ORBB) shows the same upward direction, from near-zero to the 5–7 range, but on sparse sampling that we treat as directional only.
Does overflight traffic track the conflict signal?
Overflight traffic and the conflict-event tempo move inversely, with roughly a one-week lag. AeroVigil's conflict-tempo series measures Iran's share of all aviation-tagged conflict events in the pipeline. That share spiked to 13.5 percent in the week of 8 June, fell as the escalation cooled, spiked again to a July high of 14.3 percent in the week of 13 July, then collapsed to 4.0 and 4.7 percent in the first two full weeks of August. Tehran traffic did the mirror image.
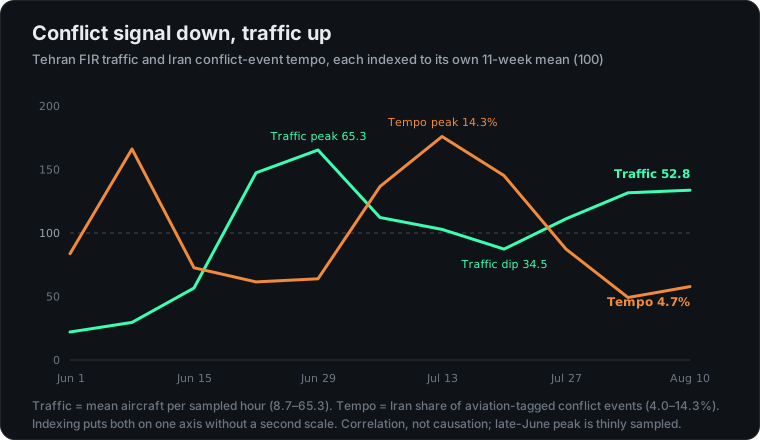
The lag is visible at the turns. The July tempo re-spike in the week of 13 July was followed by the traffic dip to 34.5 in the week of 20 July. The August tempo collapse was accompanied by traffic re-climbing above 52. This is a correlation, not a proven causal chain, and the sample is a single theatre over eleven weeks. The plausible mechanism is straightforward: operators and their flight-planning desks pull back from a FIR when the conflict signal spikes and route back through it as the signal subsides. Traffic is a lagging, revealed-preference read on the industry's own risk appetite — it tells you what operators actually did after weighing the conflict-zone overflight risk, not what a headline said.
What does this mean for overflight risk, and the technology to track it?
A traffic recovery is not the same as an all-clear. The threat vector — conflict-zone overflight risk, where military activity, air-defence posture, or GNSS jamming and spoofing can degrade the safety of an overflight — does not vanish because carriers return. Returning traffic can lag the real risk picture, because commercial pressure to shorten routes and burn less fuel pushes operators back into recovering airspace before the underlying posture is fully settled. A rush back into a FIR is itself a risk signal worth watching, not only a reassurance.
The mitigation is to track the airspace posture continuously and independently of the traffic count. AeroVigil's pipeline classifies each intelligence item by disposition and tracks the armed-conflict footprint across every theatre, so a falling headline tempo does not get mistaken for a settled airspace. Pairing that disposition with the fleet's own revealed behaviour — is traffic returning faster than the threat is easing? — is exactly the input a pre-flight risk assessment workflow turns into a go, no-go, or minimum-flight-level decision. The mechanics of that posture, including prohibited versus restricted airspace and the role of the NOTAM, are covered in our guide to conflict-zone and overflight risk.
Forecast scorecard: grading the July tempo issue
This section grades the three forecasts from the previous data issue, Iran's Peak Rolls Over (3 August 2026). Its forecast window runs 3–30 August 2026; two full weeks (3–9 and 10–16 August) are now observable, so these grades are partial and the window remains open.
- Forecast 1 — Iran's tempo stays below 12 percent every week (likely): on track. Observed shares were 4.0 percent and 4.7 percent in the first two full weeks. Both sit well below the 12 percent bar.
- Forecast 2 — the Iran–Ukraine gap stays within 3 points (even chance): tracking toward miss. In the pipeline's aviation-tagged series, Ukraine registered near zero while Iran held 4.0 and 4.7 percent, so Iran led by more than 3 points in both observed weeks.
- Forecast 3 — armed-conflict classification share stays at or above 5.0 percent (likely): tracking toward miss. The classification share printed 4.25 percent and 3.91 percent in the first two full weeks, below the 5.0 percent line after a late-July run above it.
The honest read: one forecast is on track, two are leaning miss with two weeks still to run. The traffic recovery documented above is consistent with Forecast 1 — a cooling Iran tempo — while the broadening thesis behind Forecast 3 has not held up so far.
Forecasts
These assessments use the probability yardstick defined in the methodology footer. Each is falsifiable, with the disconfirming observation and a deadline stated. The window is the four complete weeks of 17 August to 13 September 2026.
Forecast 1 — Tehran holds its recovery (likely). The Tehran FIR weekly mean will stay at or above 40 aircraft per sampled hour in a majority of complete weeks in the window. Disconfirmed if the weekly mean prints below 40 in a majority of those weeks.
Forecast 2 — no return to the June trough (highly likely). The Tehran FIR weekly mean will stay above 25 aircraft per sampled hour in every complete week of the window. Disconfirmed if any complete week prints at or below 25.
Forecast 3 — the conflict signal stays cool (likely). Iran's aviation-tagged conflict-event tempo share will stay below 8 percent in a majority of complete weeks in the window, the condition under which the inverse model expects traffic to stay recovered. Disconfirmed if the share reaches 8 percent or higher in a majority of those weeks. Live ground-truth airspace status remains at the flight-risk feeds.
Frequently asked questions
Does returning overflight traffic mean the airspace is safe?
No. Returning traffic is a revealed-preference signal about operator risk appetite, not an airspace ruling. Carriers face commercial pressure to shorten routes, and can route back into a FIR before its underlying threat posture is fully settled. The safety question depends on current NOTAMs, flight-level restrictions and air-defence posture — consult the live flight-risk feeds.
What does "aircraft per sampled hour" measure?
It is the mean number of aircraft observed in a FIR across the hours AeroVigil sampled in a given week. It is a coverage-normalized ratio, so weeks with more or fewer sampled hours remain comparable. It is not a total flight count and not an air-traffic-control figure.
Why compare Tehran with Kyiv?
Kyiv (UKBV) is a stable-baseline control. Its traffic held flat near 24 aircraft per sampled hour across the whole window, so a genuine change in the Middle East FIRs should stand out against it. Damascus rising while Kyiv stays flat is evidence the recovery is real, not a measurement artifact.
How does this relate to the conflict-event tempo series?
The tempo series tracks how concentrated aviation conflict reporting is in a theatre. This piece adds the fleet's own response — the traffic that actually flew — which tends to move inversely to the tempo with about a one-week lag. The two together separate where the headlines are from what operators did about them.
Methodology
AeroVigil's pipeline ingests and classifies aviation-relevant signals across every monitored theatre. Traffic series: FIR-level hourly aircraft-count sampling, ADS-B-derived and reported as aggregate counts at FIR-hour granularity; the metric is mean aircraft per sampled hour, a ratio that controls for uneven sampling density. Tempo series: Iran's share of aviation-tagged conflict events (GDELT, quad-class 3 and 4), a fixed source ingested across the whole window, expressed as a share to control for pipeline-volume growth. All aviation-tagged conflict events sit near the floor of the GDELT intensity scale, so the tempo metric measures the frequency and concentration of conflict reporting, not event severity. Probability yardstick: highly likely ≥ 80%; likely 60–80%; even chance ~50%; unlikely 20–40%; highly unlikely ≤ 20%. Source grading: AeroVigil grades sources on a five-tier reliability model; a single open-source report is treated as a lead, not a confirmed alert. See our methodology for the full approach to source reliability, analyst-in-the-loop verification, and classification.
_Last reviewed: 20 August 2026._