Aviation Conflict-Event Tempo, June–July 2026: The Spike Reverted, the Footprint Did Not
The June 2026 conflict-event spike over Iranian airspace is gone, but the airspace risk it created is not. Iran's share of aviation conflict events fell from a 13.5% June peak back to about 5% by early July — yet AeroVigil's contested-airspace classifications kept compounding, peaking two weeks after the tempo.
On this page · 12
- How did last month's forecasts hold up?
- What did Iran's conflict-event tempo actually do?
- Why did the avoidance footprint keep growing after the tempo faded?
- Which theatre is rising as Iran recedes?
- What does this mean for the threat picture and the technology to track it?
- Forecasts
- Frequently asked questions
- Does a falling conflict-event tempo mean an airspace is safe again?
- Why does AeroVigil use share metrics instead of raw event counts?
- What is the difference between event tempo and an avoidance footprint?
- Is this an event-driven brief about a specific incident?
- Methodology
The June 2026 conflict-event spike over Iranian airspace is gone, but the airspace risk it created is not. In AeroVigil's pipeline, Iran's share of all aviation-tagged conflict events fell from a 13.5% peak in the week of 8 June back to roughly 5% by early July — a full reversion. Over the same period, AeroVigil's own contested-airspace classifications kept compounding, peaking two weeks after the event spike and holding at more than double their spike-week level. The headlines left Iran; the avoidance signal stayed.
Data window: 1 June – 5 July 2026. Sources: AeroVigil's intelligence pipeline (normalized intelligence items and their threat-signal classifications) and GDELT aviation-tagged conflict events ingested into the same pipeline. Because the pipeline's total ingest volume grew across the window, every cross-week comparison below uses a share or ratio metric, never a raw count presented as a world trend. See the methodology footer.
How did last month's forecasts hold up?
This is the second issue of AeroVigil's monthly trend-and-forecast series, so it opens by grading the June issue's three forecasts against the data that has since arrived.
Forecast 1 — "The avoidance footprint outlasts the event spike" (likely). Status: on track to hit. The June issue predicted weekly contested-airspace classification volume would stay at or above its 8-June-week level (119 items) through the week of 13 July. Every observed week since has cleared that bar: 268, then 396, then 334 items for the weeks of 15, 22 and 29 June. The deadline week has not yet arrived, but the forecast is tracking as a clear hit. One honesty note: measured as a share of the growing classified pipeline, the footprint peaked in the week of 22 June and eased slightly after — the thesis holds on both the raw-count and the share view, which is the stronger test.
Forecast 2 — "Iran's tempo share settles above its pre-spike floor" (even chance). Status: open, tracking at the low edge. The forecast expected Iran's weekly share to hold between roughly 6–7% and its 13.5% peak through July. The most recent complete week (29 June–5 July) printed 5.15% — above the 5% disconfirmation line, but below the comfort band the forecast described. This one is live and genuinely at risk: another week below 5% would disconfirm it.
Forecast 3 — "A single spike day is not predictive of sustained escalation" (highly likely). Status: hit, holding. The 8 June spike mean-reverted within two weeks and has stayed reverted through 5 July, with no fresh trigger producing a new sustained elevation. The mean-reversion pattern governed the window exactly as forecast.
What did Iran's conflict-event tempo actually do?
It spiked, then it fully reverted. Iran's share of weekly aviation-tagged conflict events sat at 6.8% in the week of 1 June, jumped to 13.5% in the week of 8 June, then fell back through 5.9%, 5.0% and 5.2% over the three following weeks. By early July the share was statistically indistinguishable from its quiet pre-spike baseline.
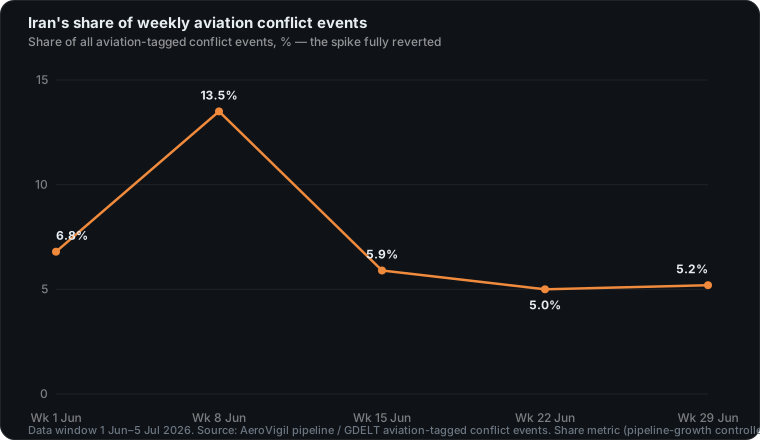
Share is the honest metric here. AeroVigil's total ingest volume grew sharply across June, so a raw event count would mostly measure the pipeline, not the world. Iran's share of all aviation conflict events is robust to that growth — if the whole pipeline doubles and Iran doubles with it, the share is flat. It did not stay flat on the way up, and it did not stay elevated on the way down.
Why did the avoidance footprint keep growing after the tempo faded?
Because operational risk lags reporting. The June issue flagged this divergence with three weeks of data; a fourth and fifth week have widened it. Indexed to the week of 8 June, Iran's event-tempo share fell to 43, then 37, then 38. Over the same weeks, the contested-airspace classification share rose to 175, peaked at 260, and held at 227.
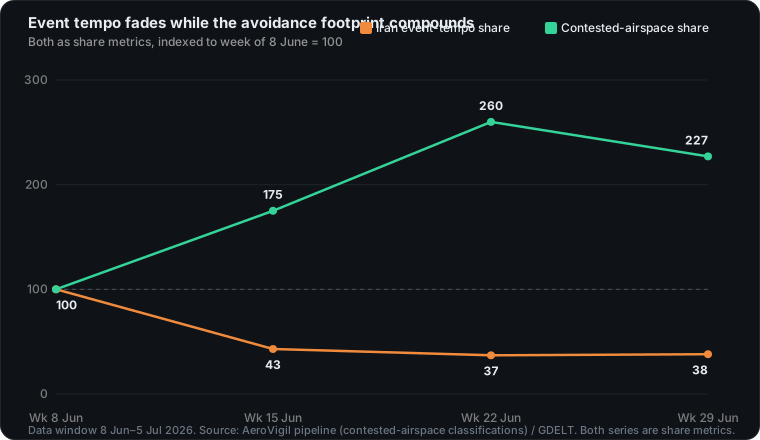
The mechanism is operational lag. A geopolitical trigger generates a burst of reporting within hours — the event-tempo spike. The operational consequences — NOTAMs, route closures, carrier avoidance decisions, and the analyst classifications that track them — accrue over days and persist after the news cycle moves on. Correlation is not causation, but the sequencing is unambiguous: the classification footprint peaked in the week of 22 June, a full two weeks after the event tempo peaked, and remained elevated as the tempo bottomed out.
For flight operations, the lagging signal is the one that matters. The day the headlines peak is rarely the day a dispatcher most needs the data; the elevated-avoidance window that follows is.
Which theatre is rising as Iran recedes?
Ukraine. As Iran's share reverted, Ukraine-geolocated aviation conflict events climbed back to 5.4% of the weekly total in the week of 29 June — edging past Iran's 5.2% for the first time since the June spike. Israel, which had tracked Iran closely through the spike, faded the other way, from 5.5% in the week of 8 June to 1.9% by early July.
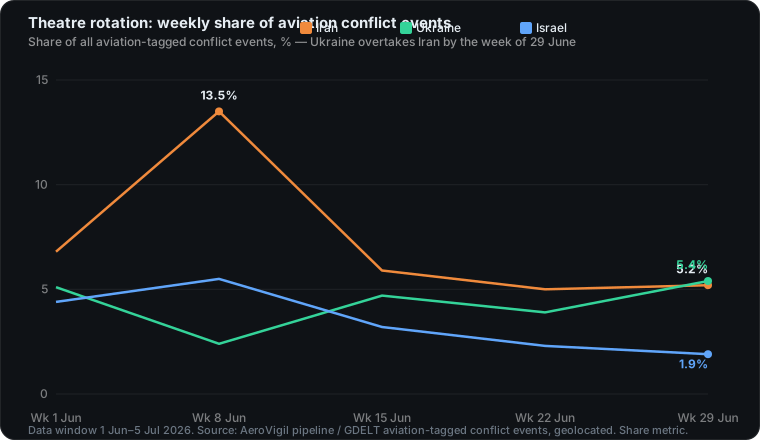
The rotation matters more than any single week's ranking. A contested-airspace posture is not a headline; it is a persistent condition that outlives the event that created it. Ukraine's share never spiked and never collapsed — it is the steady background risk that a spike-driven news cycle tends to obscure. The mechanics of that persistent posture — prohibited versus restricted airspace, the role of NOTAMs, and why a single open-source report is not an alert — are covered in our guide to conflict-zone and overflight risk and in the glossary.
What does this mean for the threat picture and the technology to track it?
The threat vector is conflict-zone overflight risk: airspace where military activity, air-defence posture, or GNSS jamming and spoofing can degrade the safety of an overflight even when no single incident makes the news. The June–July data shows why event-driven monitoring alone is insufficient — the event tempo told you Iran was a story on 8 June and told you it was over by 22 June, while the operational risk was still climbing.
The mitigation is continuous, FIR-level classification rather than incident alerting. AeroVigil's pipeline attaches a disposition to each intelligence item and tracks the contested-airspace footprint independently of the reporting cycle, which is what let this analysis see the tempo–footprint divergence at all. That durable disposition is the input a pre-flight risk assessment workflow turns into a go/no-go call — converting a transient event spike into a trackable airspace posture instead of a one-day alert.
Crucially, the current status of any specific airspace is volatile and is not frozen in this article. For the live disposition — whether overflight is advisable today, and at what flight levels — consult the continuously updated flight-risk feeds rather than any static figure here.
Forecasts
These assessments use a fixed probability yardstick, defined once in the methodology footer. Each is falsifiable, with the disconfirming observation and a deadline stated.
Forecast 1 — The tempo–footprint decoupling persists (likely). The contested-airspace classification share will remain at or above 2.5% of weekly classified items through the week of 2 August 2026, even though Iran's event-tempo share has reverted to roughly 5%. Disconfirmed if the contested-airspace share falls below 2.5% for two consecutive weeks before 2 August without a fresh escalation trigger.
Forecast 2 — Ukraine holds the top single-theatre tempo share (even chance). Ukraine's weekly share of aviation conflict-event tempo will exceed Iran's in a majority of the complete weeks of July 2026. Disconfirmed if Iran outranks Ukraine in three or more of July's complete weeks. Live ground-truth status remains at the flight-risk feeds.
Forecast 3 — Iran does not re-test its June peak in July (highly likely). Absent a fresh trigger, Iran's weekly event-tempo share will not return to its 13.5% June peak in any complete week of July 2026. Disconfirmed if any complete July week prints an Iran share at or above 13.5%.
Frequently asked questions
Does a falling conflict-event tempo mean an airspace is safe again?
No. Event tempo is a reporting-intensity signal, not an airspace ruling. In June–July 2026 Iran's tempo reverted while the operational avoidance footprint was still elevated. The safety question depends on NOTAMs, flight-level restrictions and current avoidance practice — consult the live flight-risk feeds.
Why does AeroVigil use share metrics instead of raw event counts?
Because the pipeline's total ingest volume grew across the window. Raw counts would conflate that growth with real-world change. Share and ratio metrics inside a fixed source window isolate the genuine signal.
What is the difference between event tempo and an avoidance footprint?
Event tempo is the rate of conflict-related reporting tied to an airspace. The avoidance footprint is the slower-moving operational response — restrictions, reroutes, and the analyst classifications that track them. In this window the tempo spiked and faded while the footprint kept compounding.
Is this an event-driven brief about a specific incident?
No. This is a trend analysis of how conflict-event tempo and airspace classifications moved across a defined window, with falsifiable forecasts. AeroVigil publishes same-week event briefs separately.
Methodology
This article draws only on AeroVigil's own intelligence pipeline and the open-data GDELT aviation event stream ingested into it. No third-party proprietary feeds are republished.
Window and pipeline-growth control. The data window is 1 June – 5 July 2026 (five complete Monday-start weeks). Because the pipeline's total ingest volume rose across the window, every cross-week comparison uses a share or ratio metric, or is indexed to a fixed base week — never a raw count presented as a world trend. Event-tempo series are pinned to a single fixed source (GDELT aviation-tagged events) ingested across the whole window; classification-footprint series are expressed as a share of weekly classified items.
Probability yardstick. Highly likely ≥ 80%; likely 60–80%; even chance ~50%; unlikely 20–40%; highly unlikely ≤ 20%.
Source grading. AeroVigil grades sources on a five-tier reliability model; a single open-source report is treated as a lead, not a confirmed alert. See our methodology for the full approach to source reliability, analyst-in-the-loop verification, and classification.
_Last reviewed: 6 July 2026._